Data Analytics

Power BI Dashboards and Analytics

Power BI Dashboards and Analytics

Course Overview

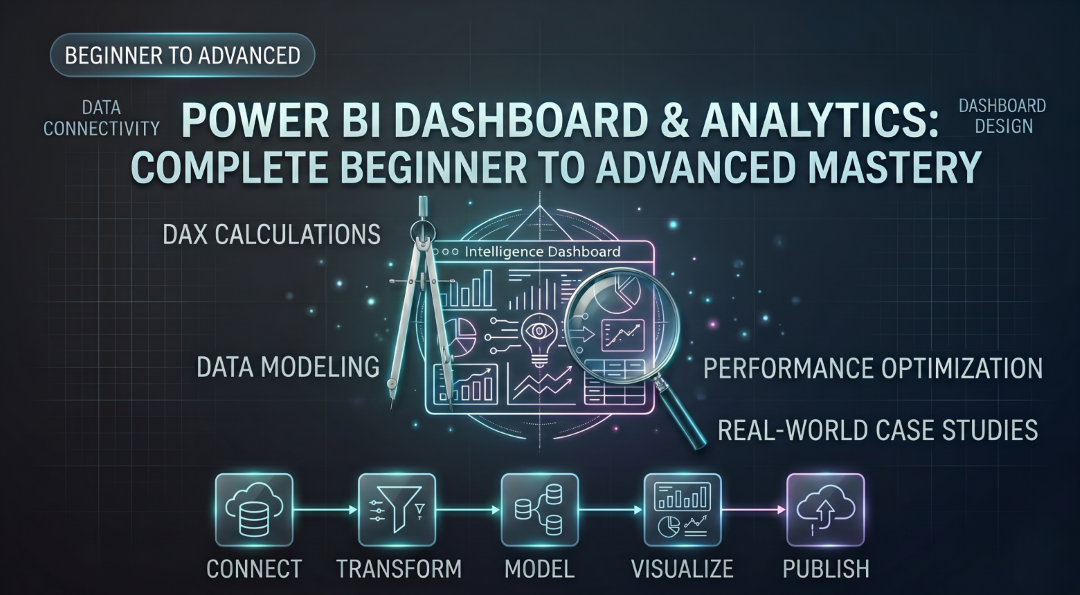
Power BI Dashboard & Analytics: Complete Beginner to Advanced Mastery is a comprehensive training program designed to help learners build professional Business Intelligence and Data Analytics skills. The course covers data connectivity, Power Query transformations, data modeling, DAX calculations, dashboard design, and report publishing using Power BI. Through hands-on assignments and real-world business case studies, participants will learn how to transform raw data into actionable insights. Students will also master advanced analytics, interactive dashboard development, and performance optimization techniques. By the end of the course, learners will be able to create, deploy, and manage enterprise-grade Power BI solutions confidently.

Training Curriculum

Get introduced to Business Intelligence, Data Analytics, and the Power BI ecosystem. Learn the Power BI interface, workflow, and core concepts needed to begin your analytics journey.

Learn how to connect Power BI to various data sources including Excel, CSV, SQL databases, web sources, and folders. Understand different connectivity and storage modes for efficient data access.

Master data cleaning, transformation, and preparation using Power Query. Build professional ETL workflows by transforming raw data into analysis-ready datasets.

Learn how to design scalable data models using fact and dimension tables, relationships, and schema design. Understand best practices for creating enterprise-grade analytics models.

Build a strong foundation in DAX by creating calculated columns, measures, and KPIs. Learn essential functions for performing business calculations and data analysis.

Explore advanced DAX concepts including filter context, CALCULATE, iterators, and time intelligence functions. Create dynamic analytical measures for executive-level reporting.

Learn visualization best practices and create impactful reports using charts, tables, KPIs, and maps. Transform data into meaningful insights through effective storytelling.

Develop interactive dashboards using slicers, drill-throughs, bookmarks, buttons, and custom tooltips. Enhance user engagement with advanced navigation and dynamic reporting features.

Improve dashboard aesthetics and usability through themes, conditional formatting, KPI highlighting, and dynamic visual elements. Create polished, executive-ready reports.

Learn how to publish, manage, and share reports using Power BI Service. Explore workspaces, apps, security settings, collaboration tools, and automated data refresh.

Understand performance tuning techniques for Power BI reports and datasets. Optimize DAX, data models, and queries to build fast, scalable, and efficient solutions.

Practical Projects

Gain confidence by shipping code to production in these real-world projects:

  • Retail Sales Dashboard
  • Executive KPI Dashboard
  • Business Performance Dashboard

Frequently Asked Questions

Yes. You will receive an e-certificate that is cryptographically verifiable on this platform, and a printed certificate on request during graduation.

The classes are live sessions hosted by certified developers, providing instant doubt resolution and code reviews.

Program Quick Specs

Duration 8 Weeks
Mode of Study Online
Certification Industry-Recognized
Course Fee ₹12,000.00 ₹7,000.00

Register for Course

Enroll today to reserve your seat. Our admissions desk will call you.

If a friend referred you, enter their code here.
Courses WhatsApp